
Negotiating prices with statistics
Analyzing price variation unveils the precise hidden value behind a product reference.

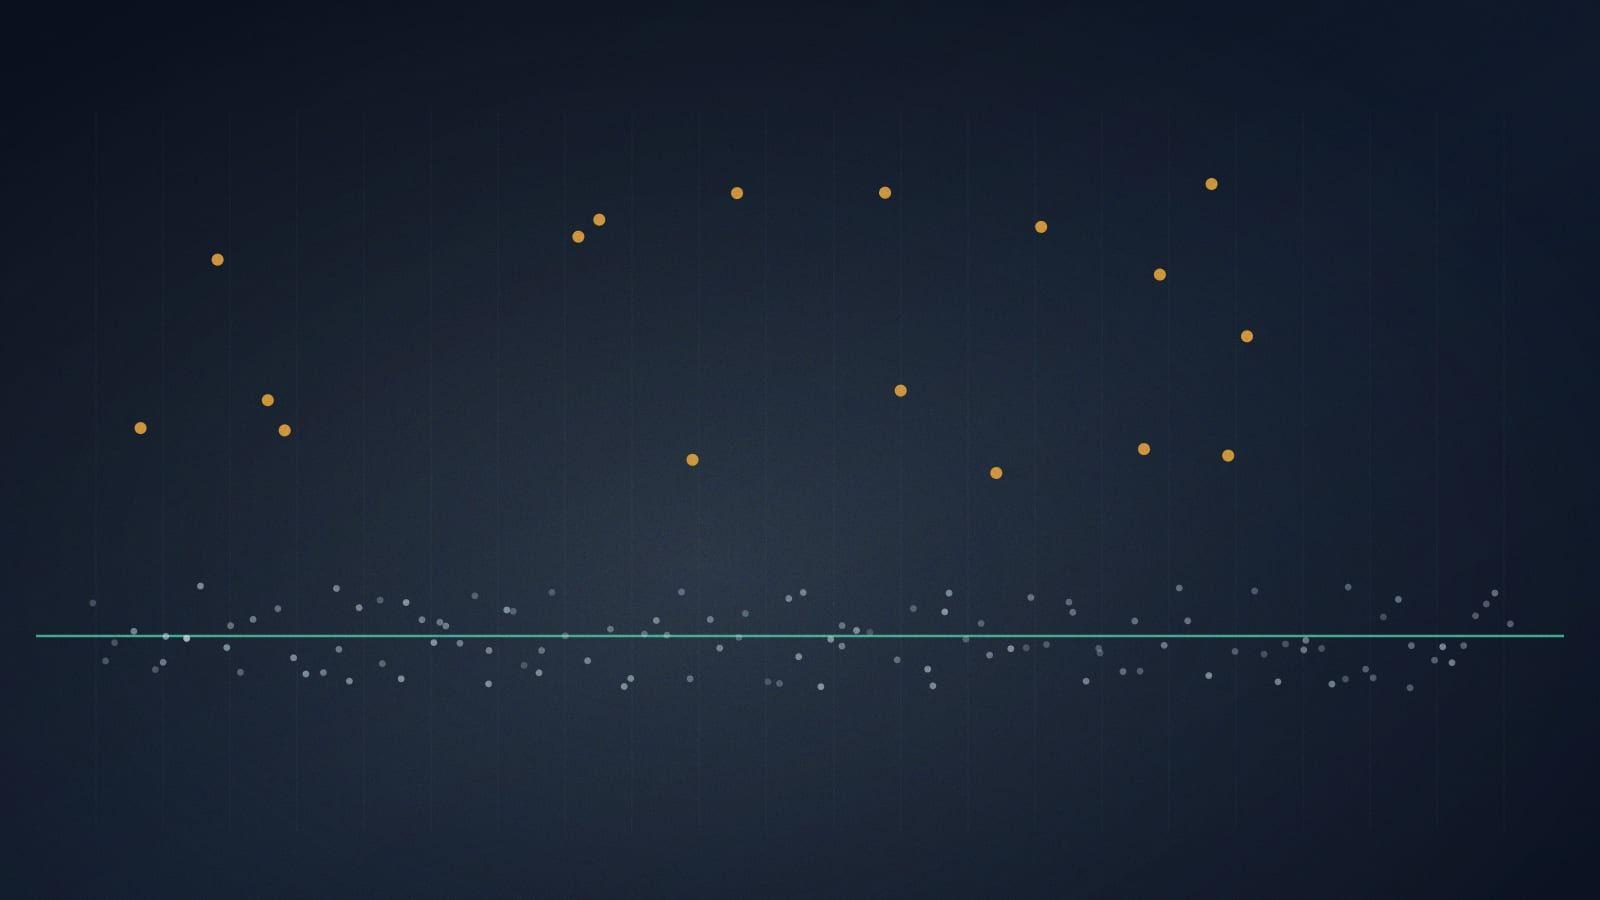
When ingesting and analyzing thousands of invoices from the same supplier, our agents often detect and flag product references whose prices tend to fluctuate. This is usually a signal that there is room to improve how this product’s price is negotiated.
Why price variability is a negotiation signal
Fakto allows buyers to list all product references that fall outside of the scope of negotiated price grids. Customers typically start by looking at references with high purchase volumes. They assume those are the most strategic references to bring to the negotiation table next year. But that’s only one part of the picture.
Of course, references with the highest spend will unlock the most value if you can bring their price down. But can all references be negotiated the same way?
Empirical data suggests otherwise, and that makes sense: the supplier’s ability to agree to a lower price depends on many invisible underlying factors: their own margin on the product, a strict price policy from the distributor etc.
This is where price variability comes into play.
Here are two examples: one where variability does not suggest savings, and one where it clearly does.
This product reference has never been negotiated by the customer and currently sits outside the negotiated price grids.
Figure 1
A reference with nothing to negotiate
$ per unit
- Billed line
- Median$9.63
| Measure | Value |
|---|---|
| Invoice lines | 14 |
| Net price, every line | $9.63 |
| Median billed | $9.63 |
| Spread, lowest to highest | $0.00 |
Nevertheless, if a buyer were to negotiate this reference with the supplier, evidence suggests they would have a tough time obtaining a better price than the always-applied $9.63.
Now take this other reference, which corresponds to a 1 meter long concrete curb.
Figure 2
A reference with real dispersion
$ per linear metre
- Above the median
- At or below the median
- Median$3.27
| Price band | Invoice lines |
|---|---|
| $2.63 - $3.21 | 31 |
| $3.27 | 9 |
| $3.33 - $3.62 | 22 |
| $3.91 - $5.37 | 7 |
| $7.35 | 1 |
Here it is much more likely that negotiations would help bring the price down. A fair assumption is that, for a sufficiently large buyer, the supplier would be willing to shake hands on the median price and insert that on the negotiated price grid.
Turning variability into a savings estimate
Now, we can ask, retrospectively: what if the median price had acted as a cap? In other words, every purchase above the median gets brought back down to it. How much money would have been saved? At Fakto, this is the metric we are most interested in: this signals how much negotiation potential a product reference has.
- Paid above median price
- $3,476.84
Our algorithms compute that precisely, and allow customers to sort and prioritize products by this estimated potential figure rather than the simple volume spend heuristic.
It also applies to negotiated price grids
This logic can also be applied to products that have already been negotiated: the price you obtained on the grid may not be the best achievable one.
Figure 3
A reference already on a negotiated grid
$ per metre
- Price match
- Under-billed
- Median billed$134.23
- Contractual tariff$155.75
| Invoice line | Net price per metre | Status |
|---|---|---|
| 1 | $155.75 | Price match |
| 2 | $133.59 | Under-billed |
| 3 | $140.00 | Under-billed |
| 4 | $155.75 | Price match |
| 5 | $126.00 | Under-billed |
| 6 | $134.17 | Under-billed |
| 7 | $155.75 | Price match |
| 8 | $131.25 | Under-billed |
| 9 | $134.17 | Under-billed |
| 10 | $155.75 | Price match |
| 11 | $134.23 | Under-billed |
| 12 | $128.34 | Under-billed |
| 13 | $155.75 | Price match |
In the example above, we see evidence of this: the price grid contractual tariff is regularly brought further down by local buyer initiatives, suggesting that centralized negotiations could push for a better deal for everyone. Once again, we quantify this potential to the cent, enabling national buyers to engage their negotiations with facts rather than intuitions.
- Paid above median price
- $1,592.20
Allowing for legitimate variability: geography & segmentation
Price on a single reference may differ for legitimate reasons. Sometimes, we need to look further into the data before making the call.
Take for example heavy machinery, fuel, cement or concrete. These elements are heavy and thus expensive to transport. If a distributor produces and stores these products from a specific point, it makes sense that the further away the resellers are from that point, the more expensive those items will be.
This is why our agents can intelligently segment invoices, and run the price deviation analysis on a per-seller basis.
A geographical representation of this segmentation then allows to directly identify patterns and dissociate valid variations from anomalies. On the map below, it is clear that the region with the highest average price is driven by only one overpriced reseller. This is a clear price anomaly, not a structural geographical concern.

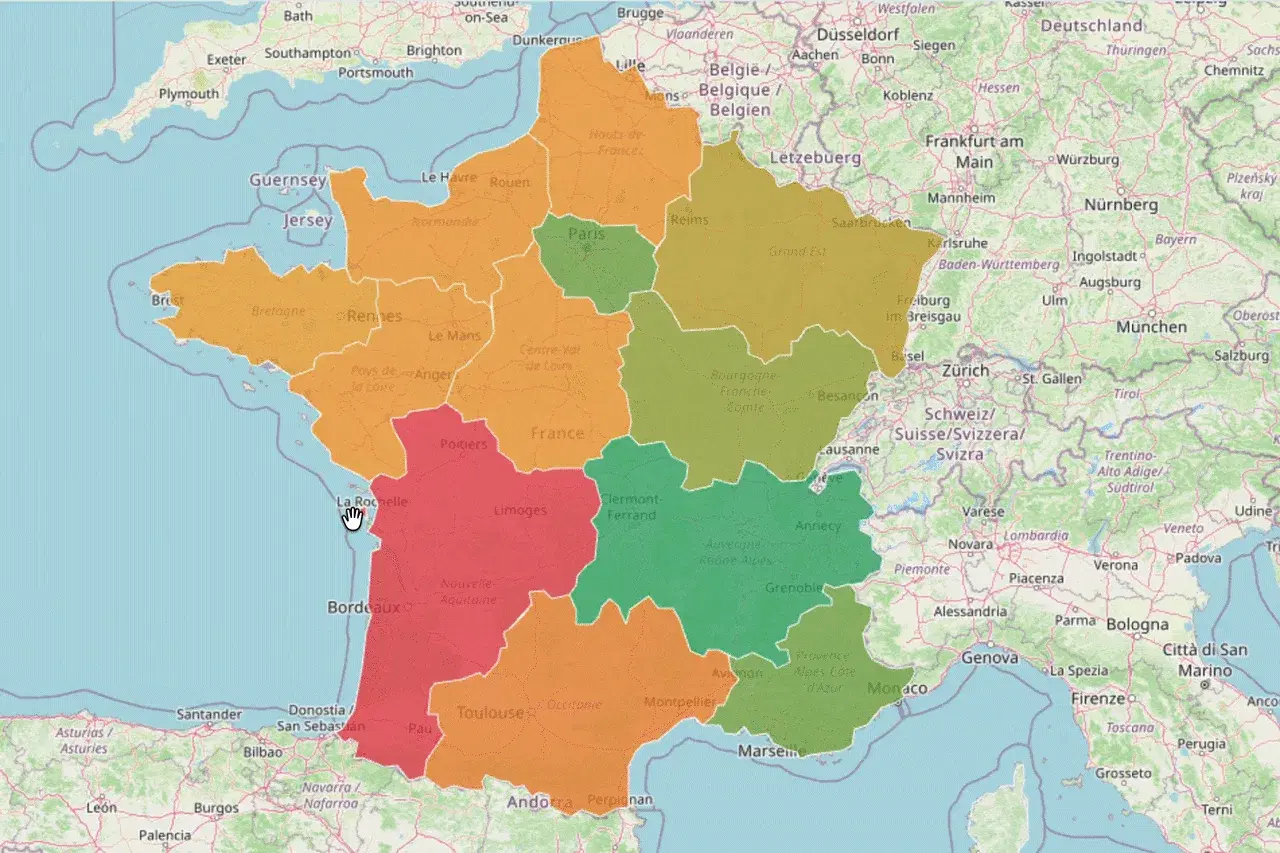
Here, the recommendation would be to either negotiate a price cap with the distributor or stop doing business with the identified overpricing reseller, and instead favor the cheaper nearby competitor.
Conclusion: AI turns invoice noise into leverage
Bringing the power of AI to invoices uncovers an immense source of value. This value was never exploited before, because this information sat in millions of unstructured PDFs which no human could tractably ingest. Fakto brings this analysis at scale and makes use of the latest models to bring to light insights that were not suspected.
See it on your contracts
Find the leakage hiding in your AP layer.
More stories

Fakto will be at DPW Amsterdam 2026

Six ways a price stops matching a contract

How a $6bn construction group found $2.9M

Deselected

How a $1.2bn services group put 15 transport carriers under continuous control

Fakto wins Gold at the DAF Night, with customer Paragon

We raised $4.2M to build the AI platform for cost intelligence